Statistical software
- Jamovi
- simple + free
- highly recommended, except if you already have experience with another one
- plugins for more advanced analyses
- based on R, so allows for a transition to R if you need full power in the future
- SPSS: commercial, expensive
- Stata: commercial for advanced analyses
- R with RStudio: very powerful but very steep learning curve
Jamovi: tutorials and guides
- Jamovi user guide (website + videos)
- Full Jamovi Tutorial by Datalab (video tutorial)
- Learning statistics with jamovi (free book)
Descriptive statistics
- Objective: data reduction (how to better summarize all the individual data?)
- 2 main components:
- central tendency
- variation
| Central tendency | Variation | |
|---|---|---|
| If normal distribution ($N ≥ 20$ + normal) | Mean ($M$) | Standard deviation ($\text{SD}$) |
| Otherwise | Median Mode… | Range (min & max) Interquartile range (IQR)… |
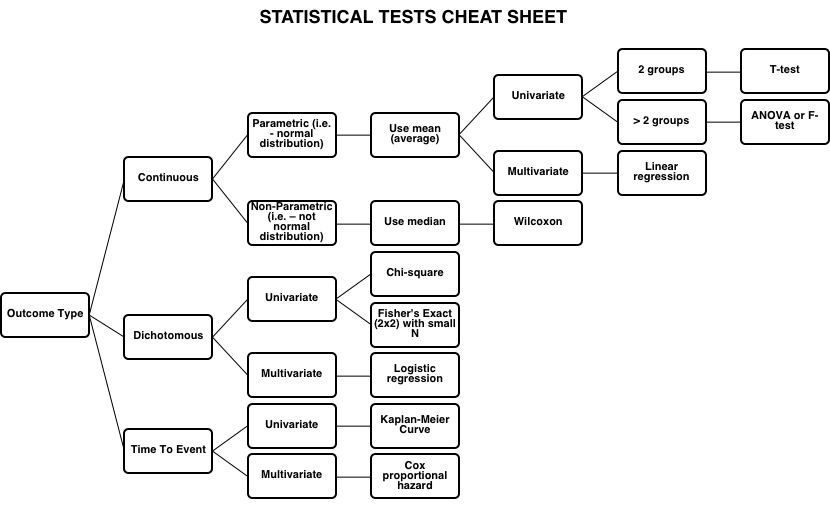
Inferential statistics
Correlation
- Objective: determine similarity between two (typically continuous) variables
Correlation coefficient: Pearson’s $r$
or Spearman’s $\rho$ (rho) if not normally distributed- from -1 (perfect negative correlation)… to 0 (no correlation)… to 1 (perfect correlation)
Group comparison
- Objective: determine if experimental treatment was significantly different than control
Significance test
(‘Null hypothesis significance testing’, NHST)
- $t$-test (Student) for 2 groups
- ANOVA for multiple conditions/comparisons
- → $p$-value
- Convention: 95% confidence
- $p < 0.05$ = significant, $p < 0.01$ = better, $p < 0.001$ = even better
- if $p > 0.05$, then no significant difference
Effect size
- Beyond significance: evaluate the size of the effect
- Measures:
- Pearson’s $r$ (correlation)
- Cohen’s $d$ (and Hedges’ $g$, very similar) $$d = \frac{M_\text{exp} - M_\text{control}}{\textit{SD}_\text{pooled}}$$